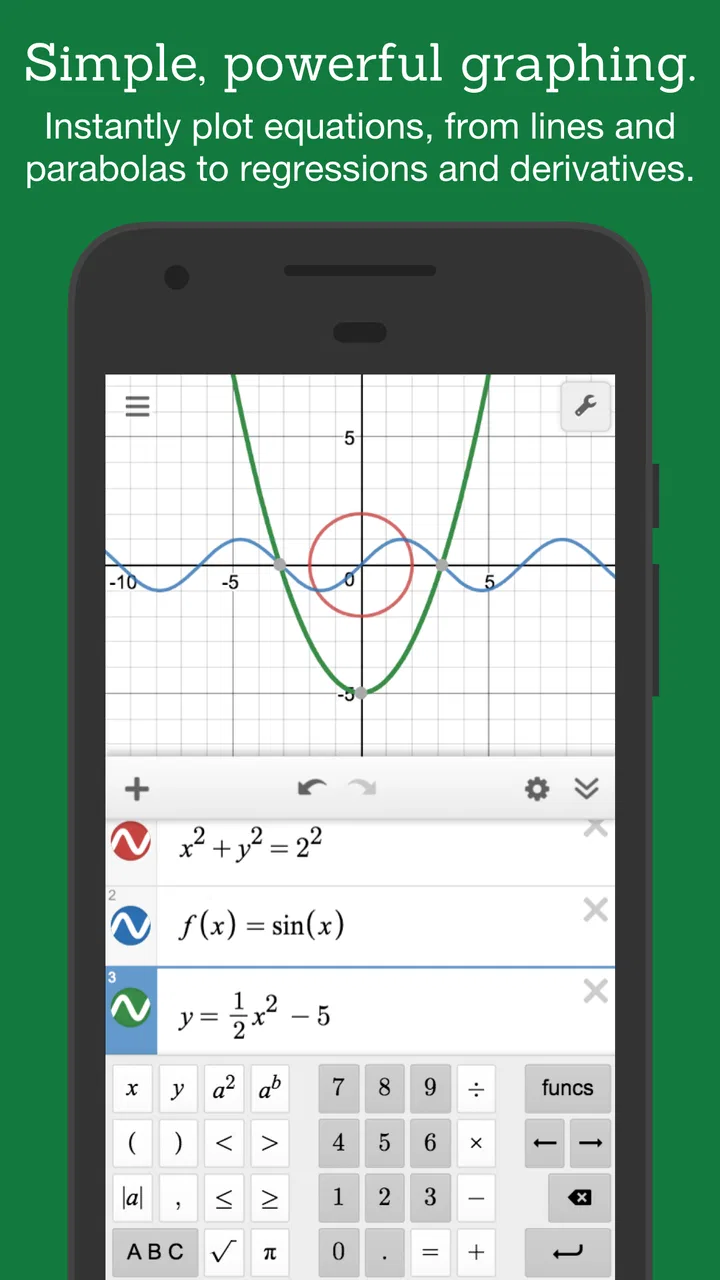
Desmos Graphing Calculator
- 4.6
- Rating
- 10.00M
- Installs
- Free
- Price

 Analysis by App-foxy
I use Desmos Graphing Calculator when I want to see what an equation is doing instead of treating algebra as a chain of symbols on a page. It is an education app from Desmos Inc, available free for everyone, and it has become one of the easiest ways I know to move between a formula, a graph, a table, and a visual explanation. The basic idea is simple, but the way those pieces work together makes it useful far beyond quickly checking whether an answer looks right.
My recommendation depends on what you expect from a calculator. If you want a focused graphing workspace for school mathematics, self-study, tutoring, or exploring a problem before writing a formal solution, this is a strong choice. If you need a full computer algebra system, a dedicated statistics package, or a tool designed mainly for handwritten notes, you may be happier elsewhere. The important distinction is that Desmos is not trying to replace every kind of mathematics software. Its strength is making relationships visible and interactive.
How I Decide Whether Desmos Is the Right Calculator
Before choosing any graphing app, I look at four practical questions. Can I enter expressions without fighting the interface? Can I compare several ideas on one screen? Can I inspect values precisely enough to learn from the result? And does the app help me understand the mathematics rather than merely produce an answer? Desmos performs especially well on the first two questions and remains very useful on the others, provided I remember that a graph is evidence to investigate, not a substitute for reasoning.
You May Also Like

 Pandora - Music & Podcasts
Pandora’s Music Is Easy to Start, but Harder to Recover
Pandora’s strength is its low-effort path from a seed to a station. Its weak spot is how much confidence it asks you to place in connection, setup, and quiet recovery.

 8 Ball Pool
 Is Built on Rivalries, Rematches, and Routine
A close look at the rivalries, rematches, shared routines, and unanswered safety questions that turn a quick pool match into a persistent mobile community.

 Samsung Music
’s Quiet Strength Is Playing What You Already Own
Its reach comes less from spectacle than from dependable access to a personal library. That simplicity is both the app’s strongest retention engine and its ceiling.

 AccuWeather: Weather Radar
AccuWeather Review: A Quick, Clear Forecast for Everyday Decisions
For everyday plans, the best forecast is the one you can understand quickly. AccuWeather makes rain timing, radar, and local conditions easy to act on, with a few trade-offs.

 Hill Climb Racing
Why Hill Climb Racing Still Turns Crashes Into One More Run
A tiny car, a bumpy hill and one more upgrade: Hill Climb Racing keeps resurfacing because its simple chaos makes every near-miss feel personal.

 AliExpress - Shopping App
AliExpress Makes Global Shopping Feel Personal, but Shoppers Bear the Risk
AliExpress turns a global marketplace into a pocket-sized discovery engine. Its reach is useful, its shopping loop compelling, and its trade-offs easy to miss.
More From Our News Desk
View All News


The current Android release is version 7.58.0.0 and requires Android 10 or later. That matters if you are installing it on an older phone or tablet. On a supported device, the uncluttered layout is one of its best qualities: I can begin with an expression, see the graph immediately, and add another line without opening a maze of menus. The app is listed in the Education category, which fits its real purpose better than calling it a general-purpose calculator.
Its public reception also reflects that focused usefulness. Desmos Graphing Calculator holds an average rating of 4.6 from around thirty-six thousand ratings, with roughly seventeen hundred written reviews, and it has passed ten million installs. Those figures do not prove that every learner will enjoy it, but they do suggest that it has become a familiar classroom and study companion rather than a niche experiment.
Start with the question, not the graph
My most reliable workflow begins by deciding what I am trying to find. If the question asks where two functions meet, I enter both expressions and inspect their intersections. If I am studying a transformation, I keep the original function visible and create a second expression that changes one parameter. If I am checking a table of values, I use the table view to compare exact inputs with the shape shown on the graph. This prevents the common mistake of zooming around until a visually convenient answer appears.
That habit is particularly important with roots and intersections. A graph can make a crossing look exact even when the relevant value is only approximate, and a narrow viewing window can hide additional behavior. I use the graph to locate a likely answer, then check the corresponding expression or table entry. For schoolwork, I still write the algebraic method separately. Desmos is excellent at showing me where to look and whether my result is plausible, but the final explanation should not be “the lines crossed on my phone.”
Sliders turn static exercises into experiments
The feature I return to most often is the slider. I can define a parameter and then vary it to watch a family of graphs change. This is much more informative than entering several separate equations one by one. For example, when exploring a translated parabola, I can adjust the horizontal and vertical shifts and observe which part of the curve moves. The visual feedback helps connect notation with behavior, especially when a sign in the formula produces an unintuitive movement.
There is a useful trade-off here. Sliders encourage experimentation, but they can also tempt a learner to hunt for a pleasing picture without understanding the parameter. I get better results when I predict the movement first, change one variable at a time, and then explain why the graph behaved as it did. A practical tip is to keep the original expression on screen in a different color. That reference curve makes transformations much easier to interpret than a moving graph viewed alone.
Tables are more powerful than a quick answer check
I find the table tool especially valuable when a graph is visually ambiguous. A table lets me inspect the function at selected inputs and notice patterns that may be difficult to see from the curve. It is useful for checking a sequence, comparing two formulas at the same values, or identifying whether a suspected intercept is actually close to zero. When I am tutoring, I often ask the learner to predict a table row before revealing it. That turns the app from an answer machine into a small test of understanding.
Tables also expose a limitation of graphing-first work: the screen can show sampled values without automatically explaining the underlying rule. If the goal is to derive a formula or prove a statement, I use the table as a source of clues, then return to symbolic work. This is one reason I would not choose Desmos alone for advanced algebra courses that demand extensive manipulation of expressions.
Organize expressions as a visual argument
Desmos becomes more useful when I treat each expression line as part of a structured argument. I might place the original function first, a transformed version beneath it, and a line or point that marks the feature I am investigating. Keeping related items together makes the graph easier to read and reduces accidental edits. I also prefer short, meaningful labels when I am building a demonstration for someone else, because a graph with many anonymous lines quickly becomes confusing.
Another small but important habit is to adjust the viewing window deliberately. Automatic framing can be convenient at the beginning, but it may hide behavior outside the initial region or make a steep curve appear misleadingly flat. I zoom out to understand the broad shape, then zoom in to inspect a particular feature. For asymptotic behavior, piecewise definitions, or functions with very different scales, changing the window is not cosmetic; it changes what I am able to notice.
Everyday use: checking a model before committing to it
A realistic example is planning a small garden bed. I can represent the available area with a rectangle, express one dimension in terms of the other, and graph the resulting area function. Moving along the curve shows how the area changes as the dimensions change. The app does not make the modeling decision for me, but it lets me test whether the relationship behaves as expected before I spend time polishing the algebra.
I use the same approach for travel time, savings goals, and simple physics relationships. I enter the proposed model, look for unreasonable values, and compare alternative assumptions on the same screen. The benefit is not that the app magically validates the model. It is that a wrong sign, an impossible domain, or an unexpected turning point becomes easier to notice. That visual inspection often catches mistakes earlier than rereading a line of symbolic manipulation.
Where this calculator beats familiar alternatives
Compared with a basic phone calculator, Desmos is in a different category. A standard calculator is faster for a single arithmetic operation, but it does not show how an output changes as an input changes. Desmos earns its place when the relationship matters: a line, curve, inequality, table, or group of related expressions. I would not open it merely to add a few expenses, but I would choose it to understand how those expenses change under different assumptions.
Compared with a paper graph, the app is quicker for trying several versions of the same idea. I can alter a coefficient, add a comparison function, and inspect the result without redrawing axes. Paper still has an advantage when I need to practice hand-drawn graphs or present a derivation in a format a teacher can assess directly. My own preference is to use both: paper for the reasoning and Desmos for testing, visualizing, and discussing the result.
Compared with a spreadsheet, Desmos feels more natural for continuous functions and geometric relationships. A spreadsheet may be better for long lists of records, repeated calculations, or data arranged in rows and columns. Desmos is better when I want the shape of a function to be the central object. Choosing between them is less about which app is more powerful and more about whether the problem is primarily a graphing problem or a data-management problem.
Compared with a computer algebra system, Desmos is easier to approach but narrower in purpose. A symbolic system is the better choice when I need extensive simplification, equation manipulation, formal calculus workflows, or advanced mathematical computation. Desmos wins when the main question is “what does this relationship look like, and how does it change?” The simpler interface is an advantage for many learners, but it also marks the boundary of the app.
Where another option may fit better
I would hesitate to recommend it as the only tool for a student whose course is centered on handwritten methods, proof, or detailed symbolic derivations. The app can support those subjects, but it does not remove the need to show the work. A learner who relies on the graph without checking domains, exact forms, or assumptions may get the right picture for the wrong reason. In that situation, a notebook and a more algebra-focused tool should share the workload.
It may also be a poor fit if your main task is entering data from an experiment and performing a broad statistical analysis. Desmos can help visualize relationships, but a dedicated statistics environment is usually more suitable for managing a large dataset or building a repeatable analysis. Likewise, if your priority is writing notes beside every calculation, a note-taking app with mathematical handwriting may feel more comfortable.
There is a smaller usability issue on mobile screens. A phone is convenient for a quick investigation, but a crowded graph with many expressions is easier to manage on a larger display. I can still work effectively on a phone by keeping the expression list short and checking one idea at a time. For lessons, tutoring, or extended exploration, a tablet or computer-sized screen is more comfortable, even though the underlying workflow remains the same.
The real cost of switching
Because the app is free, the main cost is not money; it is learning a new way to organize mathematical thinking. Someone used to a basic calculator may initially spend time understanding expression lines, graph windows, tables, and sliders. I consider that a worthwhile investment if graphs are part of your studies, but it is unnecessary overhead for people who only need arithmetic.
The switch is easier when I begin with one expression and one question. I do not try to learn every control at once. First I enter a function, then I add a second one, then I inspect a point or table, and only after that do I experiment with parameters. This staged approach keeps the interface from becoming a distraction. It also teaches a transferable habit: change one mathematical idea at a time so that the result remains interpretable.
For teachers and tutors, the larger adjustment is planning how the app fits into instruction. A beautiful graph can make a lesson engaging, but students still need prompts that require predictions, explanations, and written conclusions. I get the most educational value when I ask, “What do you expect to happen before moving the slider?” and “What evidence supports that answer?” Without those questions, the app can become an impressive demonstration that learners watch passively.
Privacy of attention and practical focus
One reason I like the experience is that it keeps the mathematical object in front of me. I can move from a formula to its visual consequence without jumping between several unrelated tools. That continuity reduces the friction of testing an idea, especially during homework when a small uncertainty can otherwise interrupt the entire problem-solving process.
At the same time, convenience can encourage overchecking. I sometimes catch myself changing the window or slider repeatedly when I should be writing a short derivation. My solution is to set a purpose for each session: verify a graph, compare parameters, estimate an intersection, or build an explanation. Once that purpose is met, I return to the original work. Desmos is most effective as part of a mathematical process, not as a replacement for one.
My recommendation for different users
For a secondary-school student learning functions, coordinate geometry, inequalities, or transformations, I recommend installing it. The immediate visual response makes abstract changes easier to discuss, and the table view provides a useful bridge between numerical and graphical thinking. I would encourage the student to keep a notebook open and record the prediction, observation, and conclusion rather than copying only the final graph.
For a university student, the recommendation is more conditional. It is still excellent for checking intuition, exploring examples, and preparing a graph for an explanation. I would pair it with a symbolic or numerical tool when the course requires more advanced manipulation. The right question is not whether Desmos can do everything in the syllabus, but whether visual exploration will help with the parts that are hardest to picture.
For a parent helping with homework, this is one of the more approachable ways to make a child’s equation less intimidating. I would avoid using it to reveal an answer immediately. Instead, enter the child’s proposed equation and ask what the graph says about its shape, intercepts, or direction. That turns a potentially frustrating homework session into a conversation about evidence.
For a casual user who wants a quick arithmetic calculator, I would skip it. The app’s value begins when you need to explore a relationship. If your normal tasks are percentages, unit conversions, or splitting a bill, a simpler calculator will be faster and less distracting.
What I would do on the first day
I would begin by graphing a line and changing its slope and intercept separately. Then I would add a second line and inspect their intersection. After that, I would create a parameterized quadratic, use sliders to alter its position, and open the table to compare selected values. These exercises take only a short session but reveal the core workflow: enter, compare, adjust, inspect, and explain.
I would also deliberately create one misleading situation, such as zooming in too far on a curve or checking a suspected root through the table. That teaches an important lesson early: the display is a model of the mathematics, and the way I frame the display affects what I conclude. Learning that limitation makes the app more useful, not less, because it encourages careful interpretation.
My final view is straightforward: Desmos Graphing Calculator is a strong free choice when seeing the mathematics is part of solving it. Desmos Inc has built an Education app that is approachable enough for beginners while still offering meaningful experimentation through graphs, tables, and sliders. Its 4.6 average rating and more than ten million installs match my experience that it is dependable for its central job, but popularity should not obscure its boundaries.
I recommend it to learners, teachers, tutors, and curious adults who want to explore functions interactively. I would not make it my only mathematical tool for advanced symbolic work, large-scale statistics, or arithmetic-only tasks. Used with that distinction in mind, it earns a permanent place in my study toolkit: not because it gives answers with less effort, but because it makes the behavior behind those answers much easier to see.
FAQs for Desmos Graphing Calculator
01What is Desmos Graphing Calculator used for?
Desmos Graphing Calculator is an interactive mathematics app for plotting functions, equations, inequalities, data points, and tables. It is useful for checking homework, exploring algebra and geometry concepts, studying trigonometry, and visualizing mathematical relationships. During testing, its responsive graphing interface made it easy to enter expressions and immediately see how changing values affected the graph.
02Is Desmos Graphing Calculator free to download and use?
Yes, the core Desmos Graphing Calculator is generally available free of charge on supported Android and iOS devices, with no payment required for standard graphing tools. You can create graphs, use sliders, enter tables, and examine intersections without purchasing a subscription. Availability and specific features may vary by platform or future updates, so checking the official app store listing is recommended before downloading.
03Does the app work without an internet connection?
Desmos Graphing Calculator can be useful offline for many basic tasks once it has been installed, including entering equations and viewing graphs. However, some features may depend on an internet connection, such as syncing saved work, accessing online activities, signing in, or receiving updates. If you plan to use it in class or while traveling, test the exact tools you need before going offline.
04Can Desmos solve equations and show step-by-step answers?
Desmos is excellent for graphing equations, finding intersections, examining coordinates, creating tables, and estimating solutions visually or numerically. However, it is primarily a graphing calculator rather than a full step-by-step algebra tutor. It may help you understand where a solution occurs, but it will not always explain every transformation needed to solve an equation by hand, so students should use it alongside their lessons.
05Is Desmos Graphing Calculator suitable for students and exams?
The app is suitable for students from basic algebra through more advanced mathematics because it combines a clean interface with powerful graphing features. It can support classroom practice, revision, and checking results. Exam rules are different, though: some tests permit approved graphing calculators while others ban mobile devices or require a specific calculator mode. Always confirm the regulations for your school or examination before relying on it.
Pros
- Free to use with no ads or subscription requirements.
- Plots multiple equations and inequalities on one graph.
- Supports sliders for exploring changing values interactively.
- Handles tables
- statistics
- regressions
- and lists of data.
- Works well for checking homework and visualizing math concepts.
Cons
- Requires internet access for some features and content loading.
- The interface may feel crowded on smaller phone screens.
- Advanced functions can take time to learn for beginners.
- Limited offline use compared with a traditional calculator.
- Not ideal for quick basic calculations without opening the graph view.

Desmos Graphing Calculator
Gallery